Cuts to Council services are a political choice
1. Evidence from Wirral Council's published accounts shows:
There is no budgetary justification for cuts to front line services nor compulsory redundancies.
Cuts to well-used local services are a political choice not a necessity.
Council income and spending on non-statutory services has increased every year since 2017.
Council net spending on Adult Care and Children’s Services is no higher than 2010.
Wirral Council is not close to bankruptcy and has £114m of earmarked reserves.
£26.2m of these reserves are for Covid 19 and could be used to cancel loans and interference from government.
The Graph of Doom prediction was significantly wrong and misleading.
2. Wirral Council's Actual Net Spend
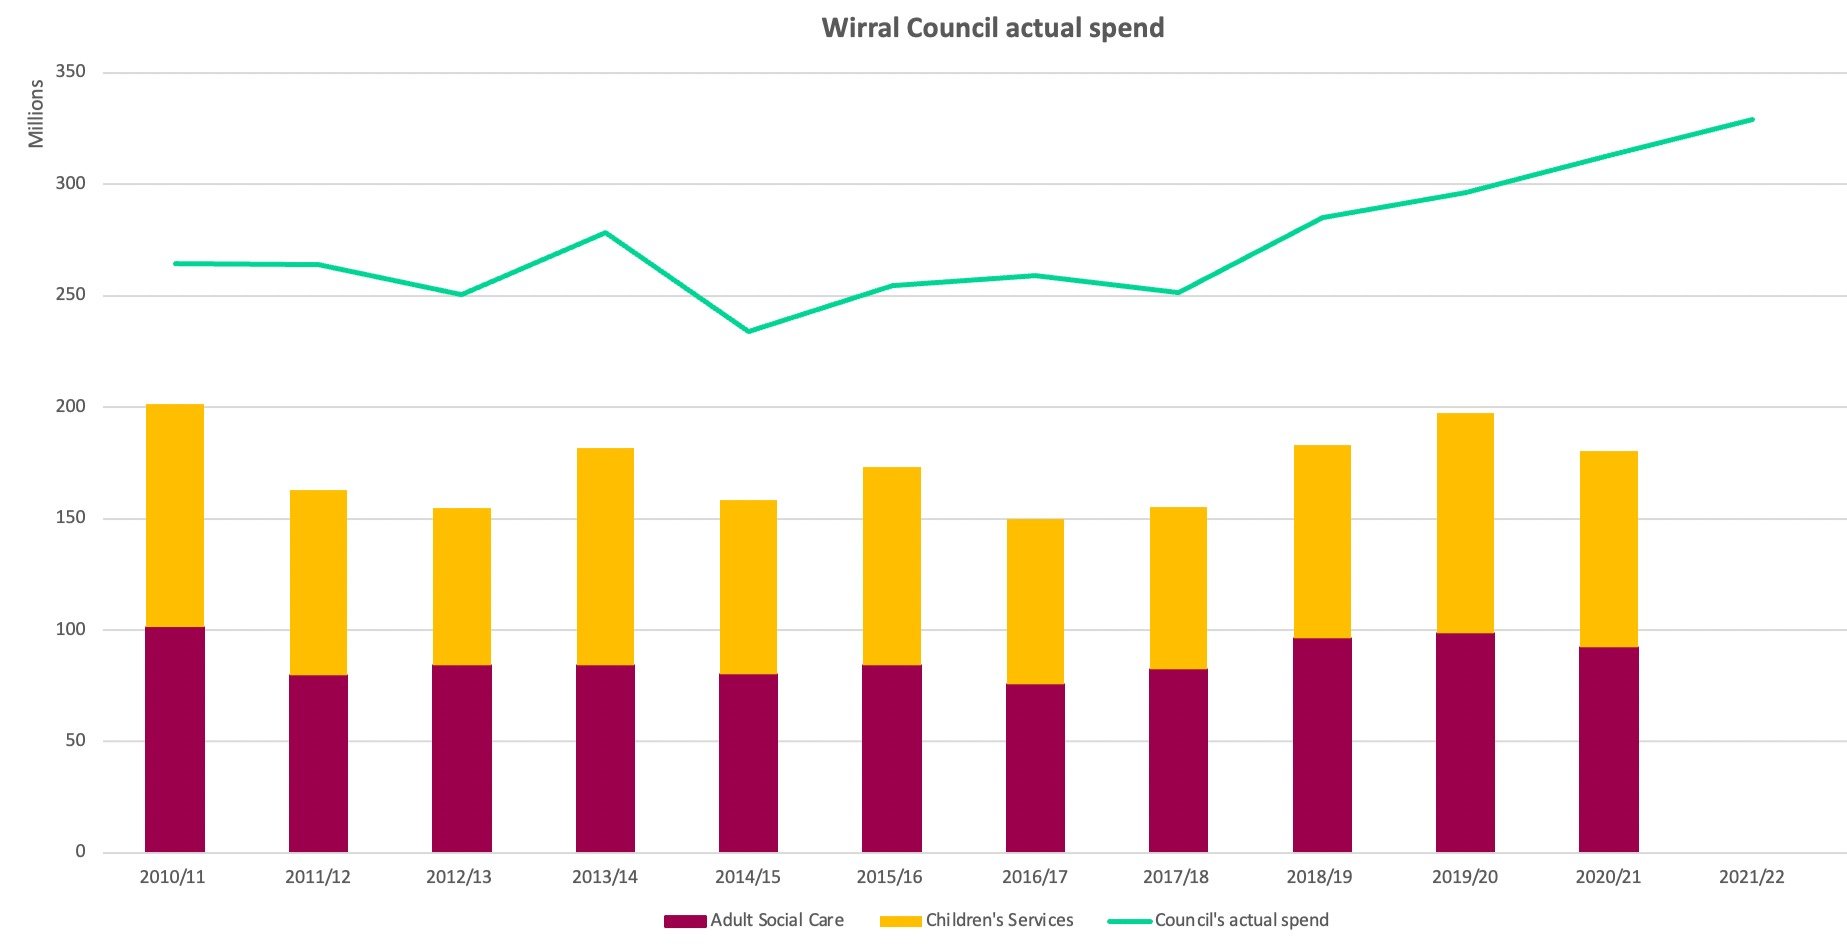
Wirral Council‘s actual spend since 2010 is shown above.
The net cost of adult care and children services has gone up and down but hasn’t risen above the levels of 2010. Even when our children services were in special measures. Meanwhile Wirral council's actual revenue spend went down to a low in 2014 but has gone up and up since then. Revenue spending is higher than 2010, even adjusting for inflation. The headroom for non-statutory services has also gone up and up.
This evidence shows there is no budgetary justification for cuts to front line services nor compulsory redundancies.
3. Table: Wirral Council's Actual Net Spend £

Source: Wirral Council’s published accounts - revenue spending and reserves pages. Anyone can create the same type of graphs for their local council, using public figures from each Council’s accounts.
4. The 'Graph of Doom' Prediction Was Wrong

The Graph of Doom was a widely circulated prediction coming out of Barnet Council in 2012. It showed the cost of both Adult Care and Children Services increasing over future years - and the Council’s income decreasing. In the prediction, non-statutory council services would have to be cut to pay for Adult Care and Children’s Services. Even these statutory services would exceed the Council’s income by 2022.
The Graph of Doom prediction was significantly wrong and misleading.
5. Wirral Council’s Reserves

This graph of Wirral Councils reserves shows the lower unallocated General Fund Balance and higher Earmarked Reserves.
In 2010, the General Fund Balance was £13.8m. It rose to a high of £25.7m in 2017. Since 2019, General Fund Balance is low at £10.7m for the last three years.
However, as the unallocated General Fund Balance has reduced, the Earmarked Reserves have gone up. Earmarked Reserves are at an all-time high of £114m.
These high levels of reserves is a good reason why Wirral Council is not close to bankruptcy, nor has there been a Report in the Public Interest from the external auditor.
6. Wirral Council's Actual Spend And Reserves

This graph combines Wirral Council graphs above and shows actual spending and reserves together. Wirral Council spent some reserves on front line services from 2010 to 2016. However since 2017, both revenue spending and reserves have increased every year.
7. What is in the earmarked reserves?
Looking in more detail at the revenue earmarked reserves of £114m (p77 of accounts 20-21).
Some reserves are contractually ringfenced for schools or specific grants/contracts, but not all.
There are £26m COVID-19 reserves which could be used to reduce the second £10.7m loan from government to zero (£3.5m reduction was announced Nov 21). As well as removing the justification for government interference, not drawing down the second loan would release around £250,000 for frontline services every year for 20 years in loan and interest repayments.
There are £9m of non-ringfenced reserves which have not been used for the last three years. Perhaps they could also be reallocated to keep front line services open?
8. Revenue Earmarked Reserves of £114m

05 December 2021